EndaceVision
Visual Traffic Analysis and Forensics

EndaceVision™ is a browser-based application - included on EndaceProbe™ Analytics Platforms and InvestigationManager - that lets security, network and IT teams investigate and resolve a wide range of network and application related issues.
Engineers and security analysts can search for, visualize and interrogate the historical network packet data recorded by the EndaceProbes deployed across the network.
With Wireshark built-in, users can even decode and examine packet data without downloading large pcaps.
See it in Action
In this short demo, Endace's VP Product Management, Cary Wright, demonstrates the rapid search and data-mining features of EndaceVision.
Cary shows how easy and quick it can be to analyze days, weeks or months of recorded packet history for incident response, threat-hunting or troubleshooting network or application performance issues.
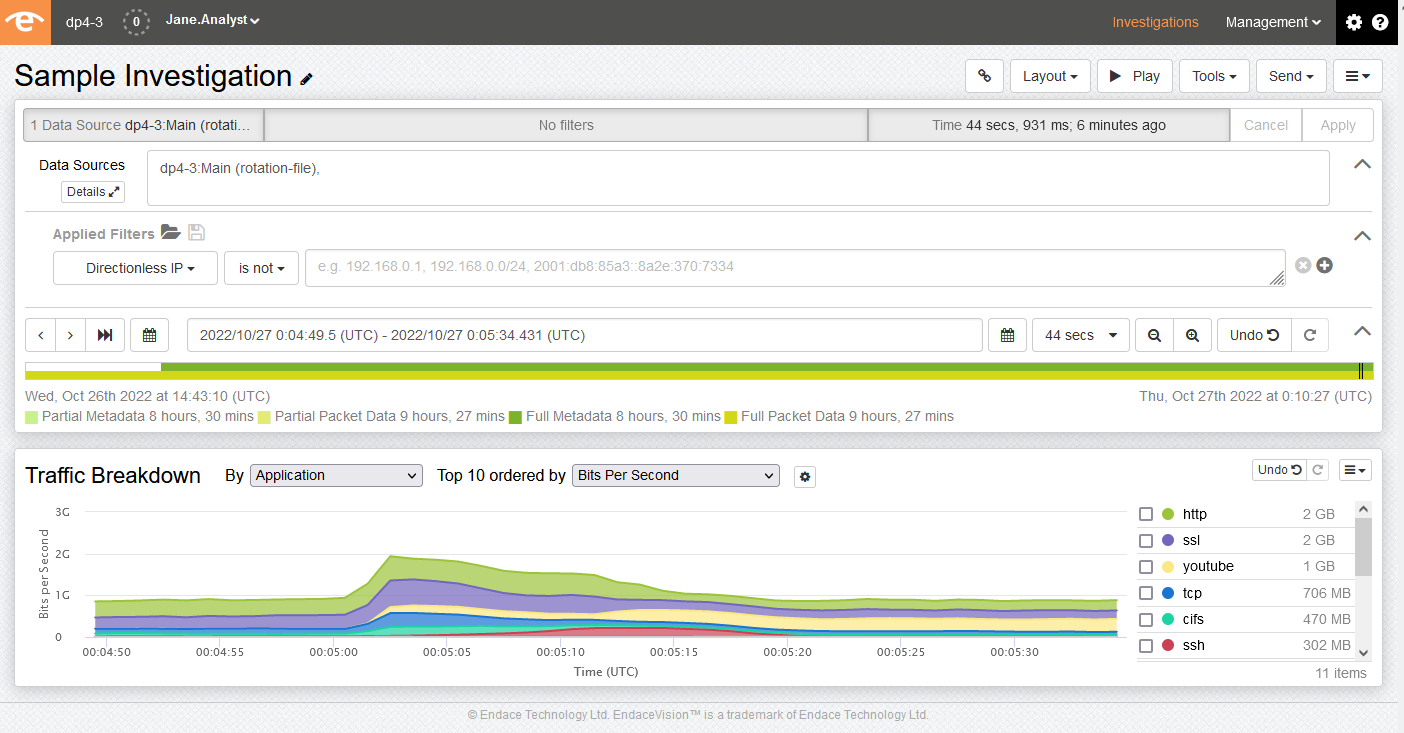
Searching, Filtering and Application Awareness (DPI)
Get to the evidence you need quickly. EndaceVision's powerful search and filtering capability make it easy to quickly zero-in on the packets relevant to an investigation.
Users can filter recorded traffic based on a wide range of parameters including link name, application classification, IP address, MAC address, port number, time stamp and many more options.
EndaceProbes also provide built-in Deep Packet Inspection (DPI) which classifies captured traffic by application. This makes it easy to analyze traffic by application to see precisely what's happening on your network.
EndaceVision Visualization Tools
Working out what happened in the event of an outage or suspected breach is typically a process of discovery, iteration and elimination. To facilitate this process EndaceVision allows users to visualize traffic in a number of different ways. Users can move between views seamlessly, add new filters and zoom in/zoom out to help find the cause of a problem.
Click on the images below to view some of the different Visualization tools that EndaceVision provides.
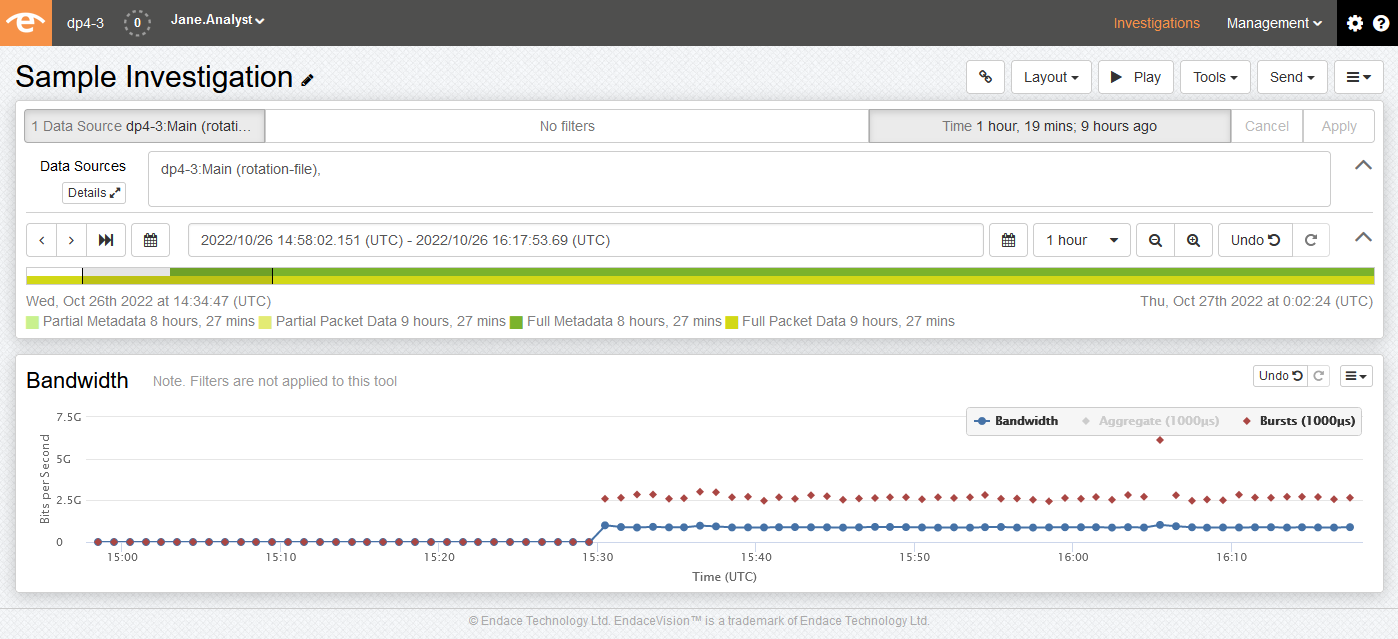
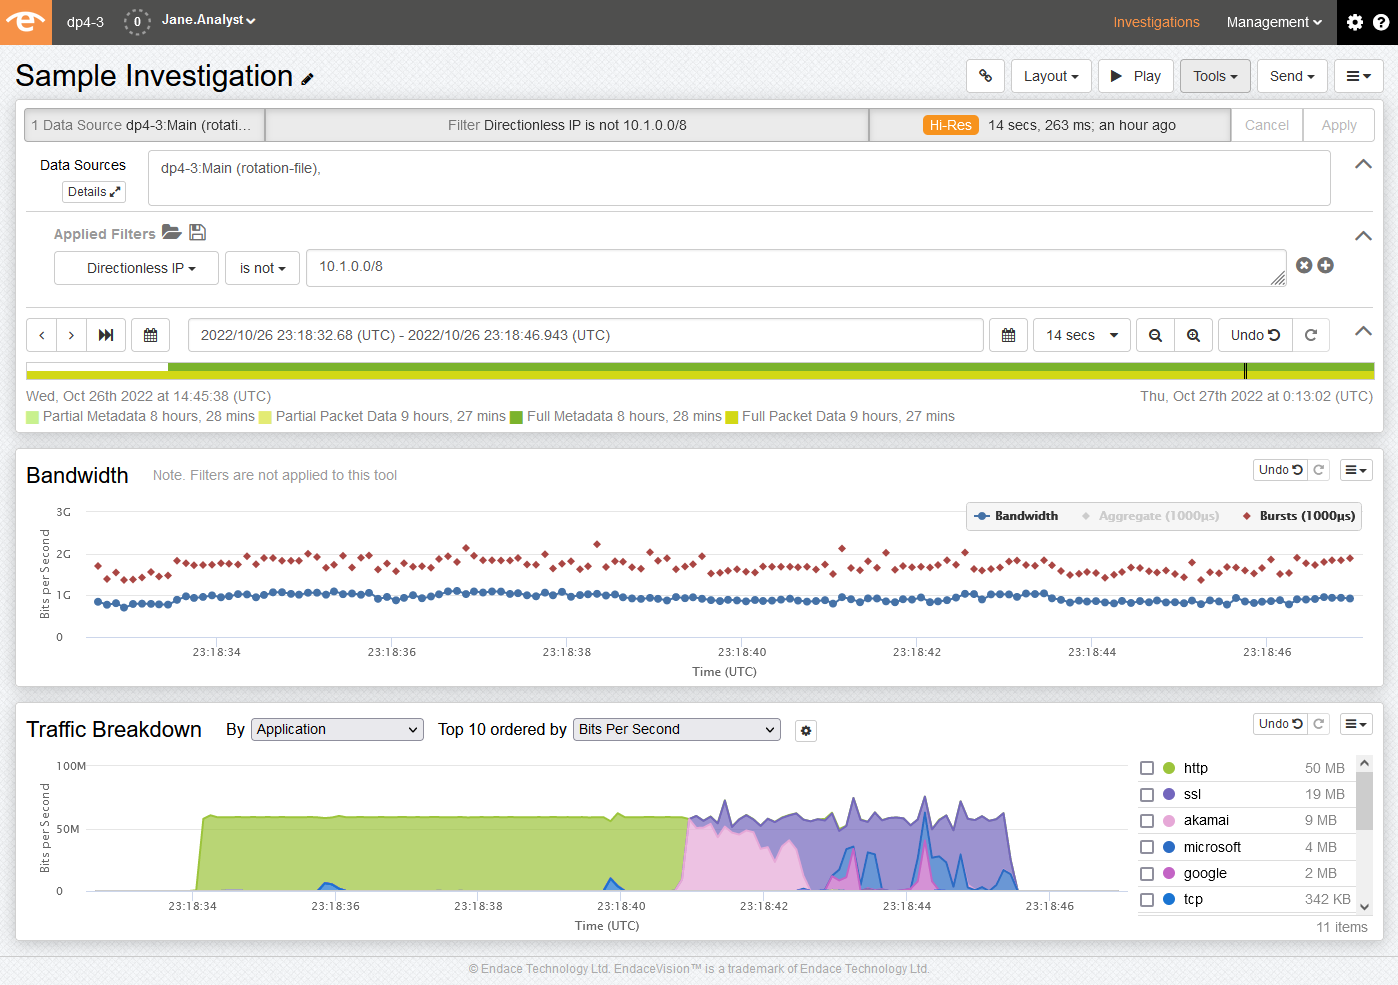
IP Bandwidth-over-time Breakdown and Burst Analysis
Bandwidth over time is typically the starting point for many investigations and allows the user to see bandwidth utilization at different resolutions, from days or months to 1000 μs where the real microbursts can be seen. The bandwidth view quickly highlights unusual traffic spikes that often explain application performance issues.
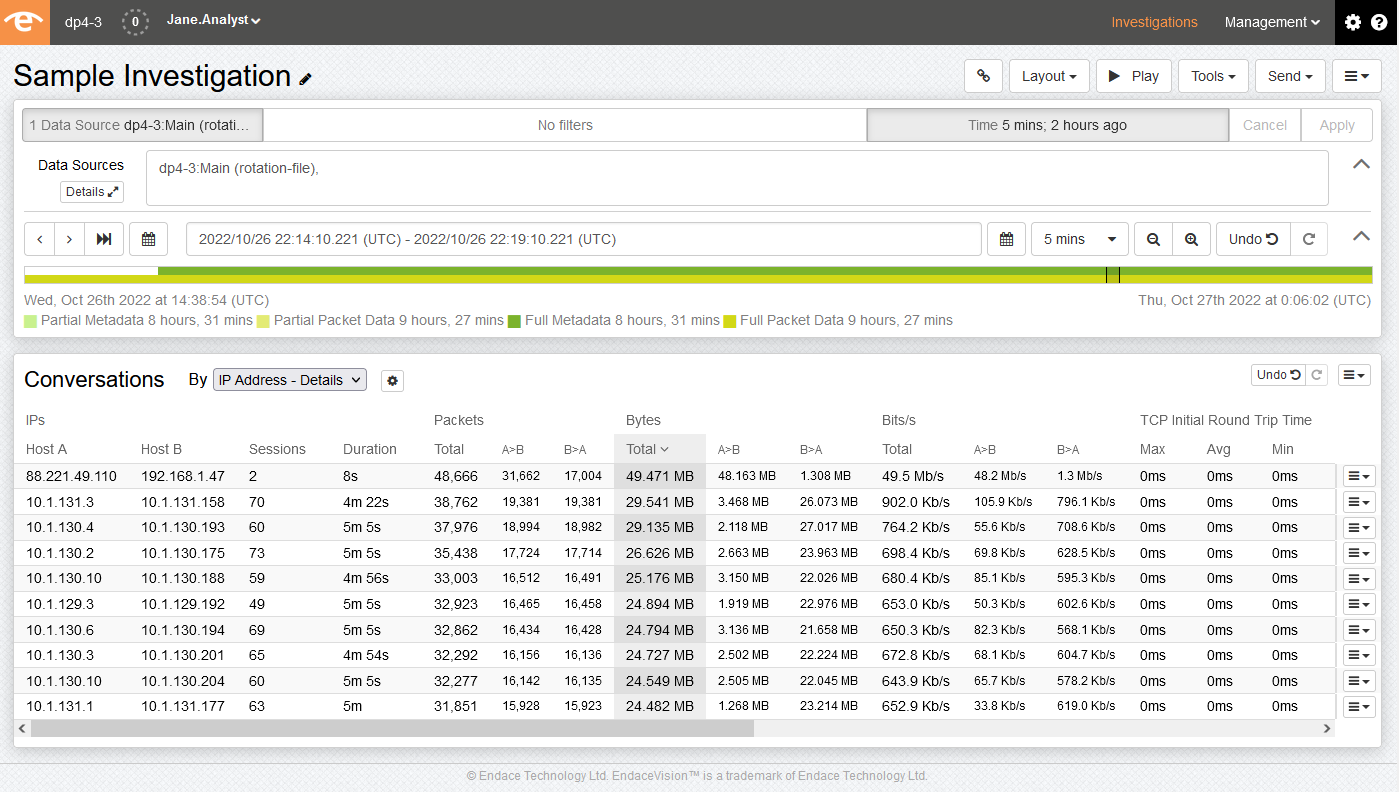
Conversations
The conversations visualization allows users to identify and isolate specific conversations at MAC, IP or transport layers. It is typically used in conjunction with Top Talkers to examine the behavior of a given host. Conversations can be sorted by total bits, packets, sessions and bit rate.
Traffic over Time
Traffic over time offers a blend of IP bandwidth over time and traffic breakdown, allowing users to visualize how much bandwidth a specific application, IP protocol, VLAN, MPLS, Port IP or MAC consumed over any given time period. This view helps to identify bandwidth hogs and diagnose performance issues.
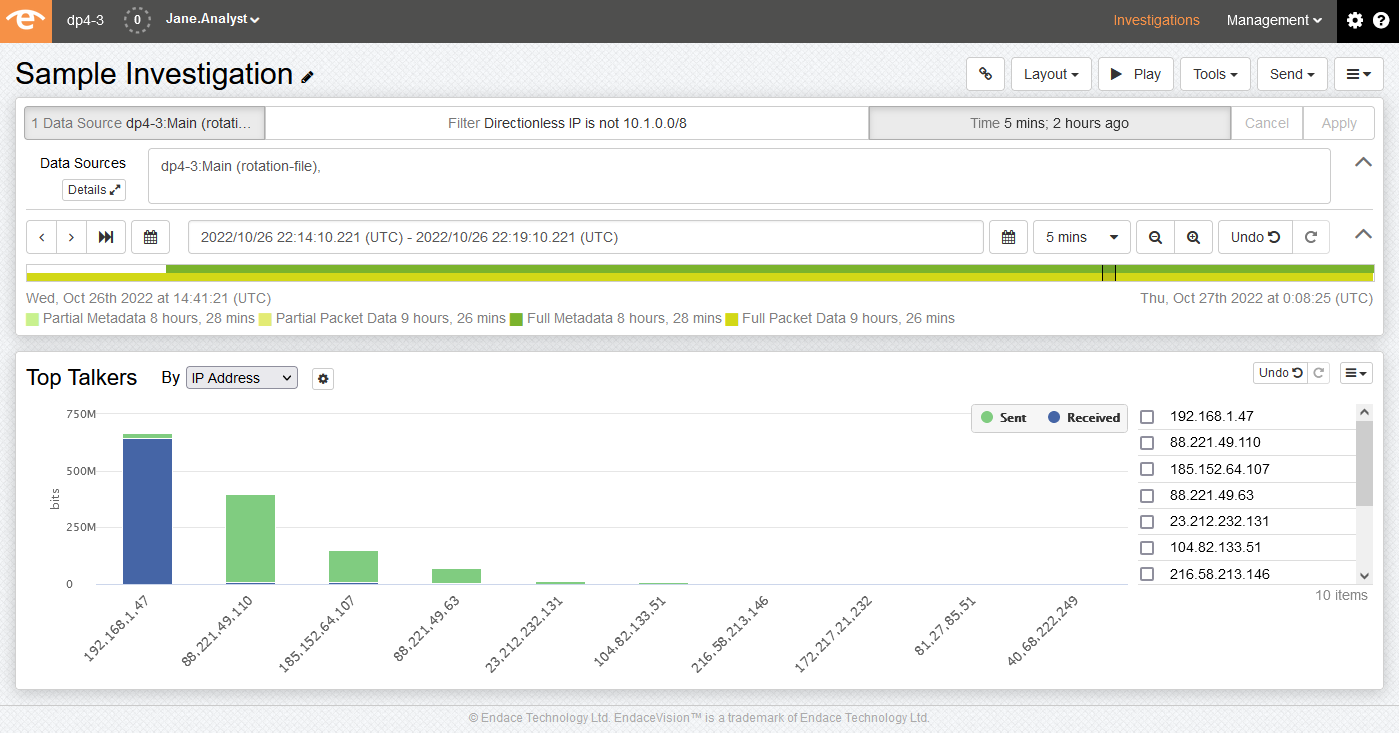
Top Talkers
Top Talkers uses graphics to show the ‘chattiest’ hosts in any given traffic segment. This allows traffic to be visualized by both number of bits and number of packets. Top Talkers helps to identify hosts that may not be configured properly or are causing congestion in the network.
MicroVision: See the Detail that Matters
Leveraging the nanosecond resolution time stamps on traffic captured by EndaceProbes, EndaceVision’s MicroVision™ feature lets users visualize events right down to microsecond-level.
Microbursts can disrupt a network in multiple ways:
- A sudden synchronous burst can flood port buffers on a switch, triggering packet drops that slow transactions.
- Real-time traffic such as voice or video works best with constant latency values, but microbursts of other traffic can create jitter that disrupts calls.
- Cyber attackers are even starting to use microbursts, making quick connections to targets that simply can’t be seen in a 30-second monitored sample.
EndaceVision makes it easy to find microburst locations with a user-friendly bandwidth visualization that displays both the average and maximum values for every sample point.
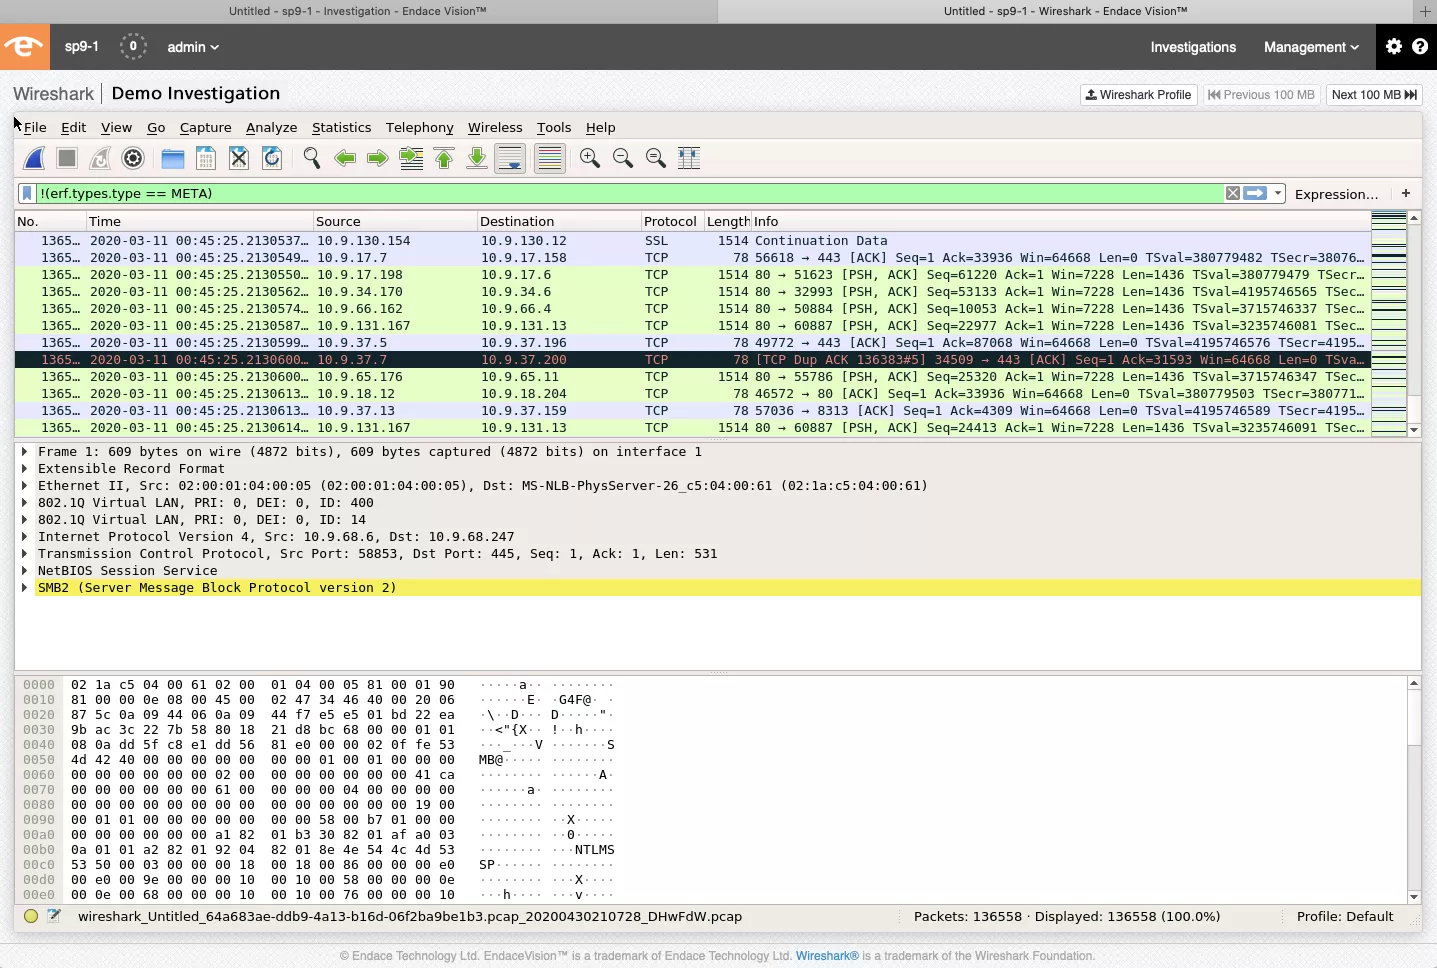
Built-in Wireshark
With EndaceVision's hosted-Wireshark you can decode and view packet data directly, without having to download huge pcap files.
Network engineers and analysts often need to access raw packet data in order to establish the root cause of a problem. The tool of choice for most is Wireshark, however, this can cause compliance problems. Organizations have a legal responsibility to minimize the risk of information loss. This means ensuring raw packet data never leaves the capture system or the datacenter confines. For analysts needing to use Wireshark on their laptop, this is a challenge that is quietly overlooked by many organizations.
EndaceVision solves this by providing access to a copy of Wireshark hosted directly on EndaceProbes or in InvestigationManager. This means packets of interest can be decoded using Wireshark without ever leaving the EndaceProbe, and network load is reduced by avoiding the need to transfer large pcap files across the network.